Your Audience are Smart Cookies: 3 Findings about User Behaviour & Cookies
Apr 29, 2025 · 3 min read


Pernilla Carlström


While we know that cookies have been a cornerstone of digital marketing strategies in the past, stricter rules surrounding user privacy, as well as increasing cookie restrictions from web browsers, may mean that marketers need to shift their attention towards privacy-enabled and consented data to inform their future strategies.
That’s why, in this post, we delve into user behaviour surrounding cookies – specifically focusing on the cookie acceptance rate across devices and regions – to find out how much tracking data you are losing from the traffic visiting your website and social media campaigns, and what you can do to compensate for these losses.
Using a data set of 1,056,751 users, across multiple Digital Advisors over the last 180 days, we discovered the following:
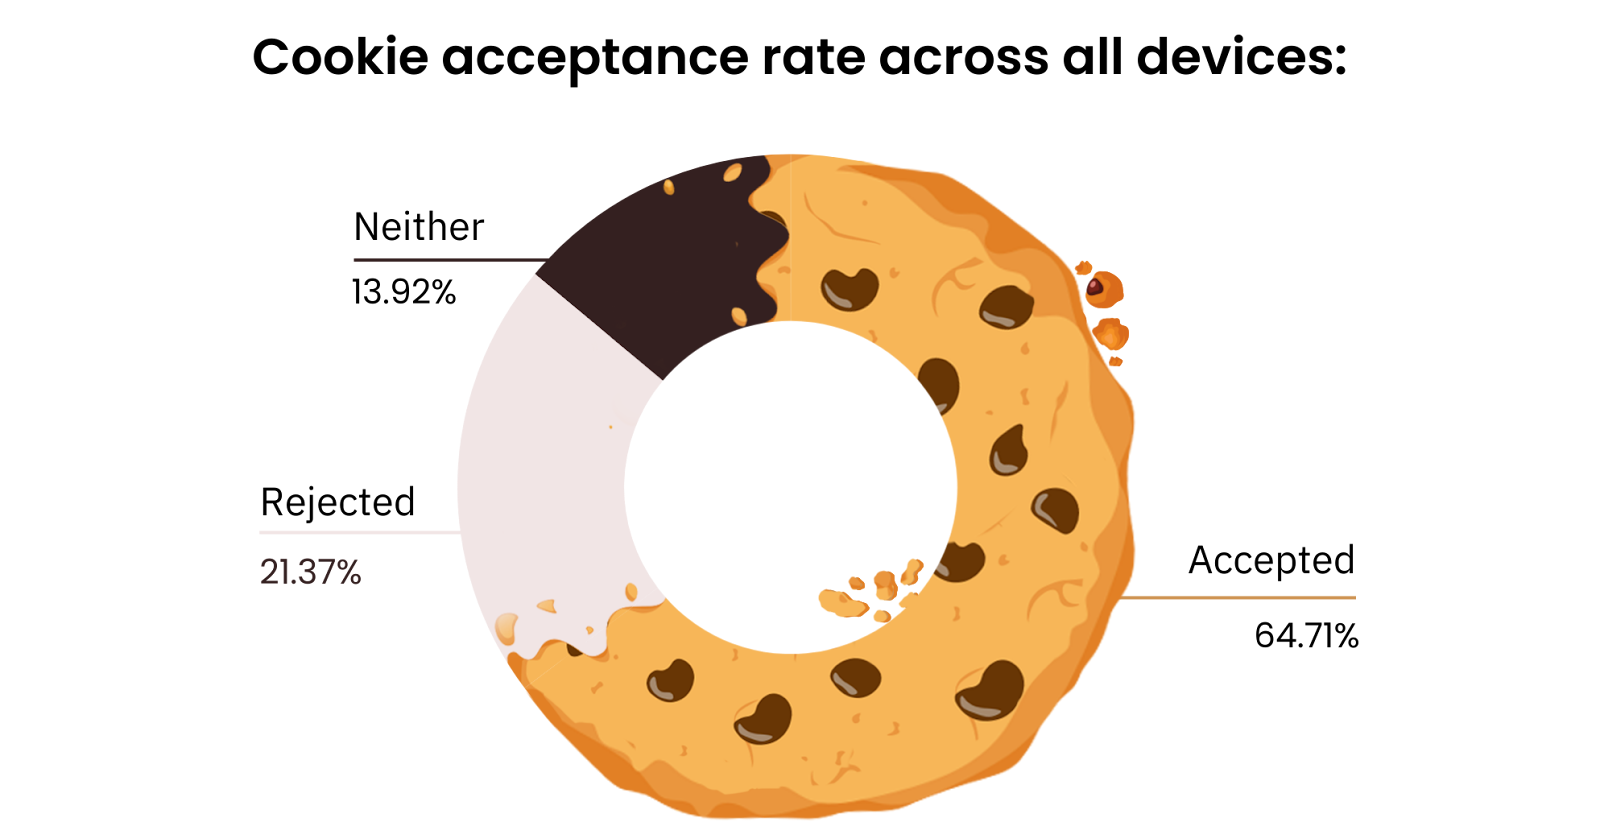
1. “How the cookie crumbles”: Approximately 1 in 3 users are not accepting cookies
Across all devices, a combined total of 35.29% of users are rejecting or ignoring your cookie request – meaning that you lose tracking access to approximately one third of your visitors.
Break this down even further, and you are losing 35.29% of your retargeting or targeted audience customisation potential.
Data set of 1,056,751 users
2. Mobile users are most likely to “bite”
Compared to a cookie acceptance rate of 22.61% from desktop users, almost double the amount of mobile users (42.10%) accept cookies.
Importantly, mobile is also the most common device used by your prospects, both in terms of organic and paid traffic. Therefore, it’s important to maintain a mobile-first strategy in your marketing.
Behavoiur across different devices (Data set of 1,056,751 users):
| Accepted/Rejected | Mobile | Desktop |
|---|---|---|
| Cookies Accepted | 42.10% | 22.61% |
| Cookies Rejected | 11.18% | 10.19% |
| Neither | 5.39% | 8.53% |
3. “A moment on the lips, forever on the hips”: Europe and India are especially cookie-conscious
LATAM and Africa are the happiest to consume cookies, with an acceptance rate of 78.91% and 76.20% respectively. However, even these higher acceptance regions still render a third-party data loss of 21.09% and 23.80%.
Moreover, Europe is the most inclined to reject cookies, and mirrors the significant 1 in 3 rejection rate mentioned in point 1 above.
Cookie acceptance rate by region:
| Region | Accepted | Rejected | Total | % accepted | % rejected |
|---|---|---|---|---|---|
| LATAM | 30,451 | 8,137 | 38,588 | 78.91% | 21.09% |
| Africa | 38,697 | 12,089 | 50,786 | 76.20% | 23.80% |
| Asia | 24,730 | 8,047 | 32,777 | 75.45% | 24.55% |
| Middle East | 15,352 | 6,008 | 21,360 | 71.87% | 28.13% |
| Oceania | 2,344 | 964 | 3,308 | 70.86% | 29.14% |
| India | 24,457 | 11,746 | 36,203 | 67.56% | 32.44% |
| Europe | 115,943 | 61,678 | 177,621 | 65.28% | 34.72% |
How to avoid “cookie-cutter” methods from the past
So what does all this data really mean for your marketing strategies? Well, as the foundation of third-party data and the ability to track your prospects continues to crumble, you will need to rely more on first-party data.
The good news is that, although 1 in 3 users across our Digital Advisors rejected cookies, they did leave their email addresses, and occasionally their telephone numbers, thus allowing for email-based and telephonic retargeting. It would appear that prospects are more trusting of your institution and services than they might be of cookies.
Therefore, providing a value-for-data exchange, such as webinar sign-ups, downloadable brochures, insider access to networking or career events – or even perhaps a personalised and well-researched quiz 😉 – allows for the potential to gather and nurture your leads.
CookiesMarketing


